Answers (Total Sample Results)
Answers to the Questionnaire
LTCOVID.com
Thanks for visiting!
To translate this page, select your
language from the dropdown menu below:
A CRUISE through the responses
Don't have time to cruise at your speed through the answers, one after another?
Looking for just 1 of the 60 question topics? Then here's your solution: The INDEX.
Questions will be presented in order, beginning here, and on the subsequent linked pages.
One question per page. The idea is to let you form your overall impression about these questions, the answers provided, and this group of respondents presenting with "long-term" COVID-19.
This oreder embodies the structure map of the Questionnaire, presented previously.
136 surveys were completed. 1 arrived after data analysis had already been performed, and we decided not to start over with all of that.
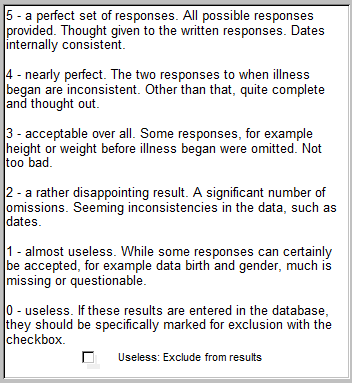
Of the rest, only 3 are not included in what follows, having been judged unacceptabel because of inconsistent dates, excessive numbers of incomplete responses and a response grade less than 1. This was based on a Likert Scale of 0 to 5 as defined below.

Using this scale, the 132 remaining questionnaires had a mean score for acceptability of 4.21±0.98.
Time to respond averaged 29 minutes, 32 seconds to complete its 60 questions.
Results based on comparisons within or between groups for specific questions, such as differences found by gender or age for example, will be presented after the complete results for the 132 taken as a complete response set.
Continue with the link below to see one question after another ...
Q.1 & Q.2 : DOB & Age >>>>>>
<<<<<< Previous page
Q.1 & Q.2 : DOB & Age
LTCOVID.com
Thanks for visiting!
To translate this page, select your
language from the dropdown menu below:
Q.1 & Q.2 : DOB & Age Range
5 respondents furnished erroneous dates of birth (entered the response date or a date after symptoms began). They had all furnished an email address, were contacted and these were corrected).
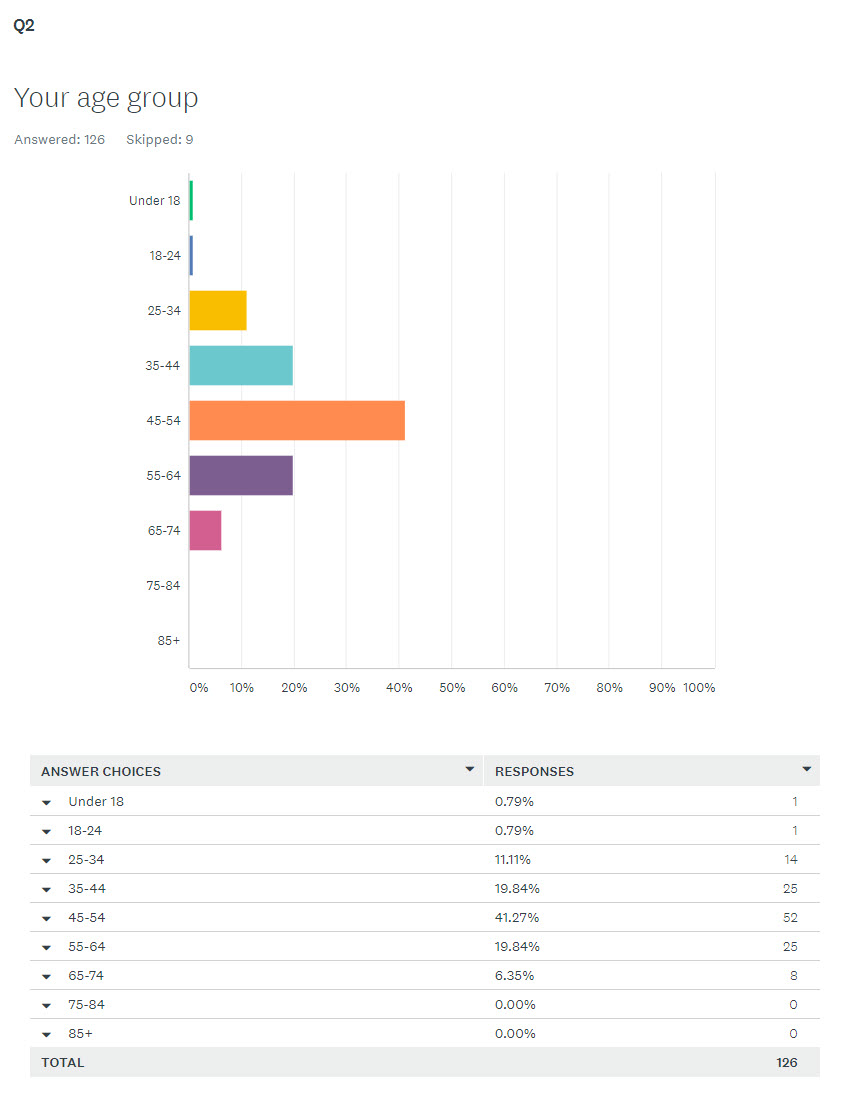
Birth dates of this sample ranged from May, 1948 to August 2003. These have been converted into age in years, and are presented below as an Age Range distribution.
Mean age was : 48.19 ± 10.90 years for n = 130.
Nine respondents who did provide DOB in Q.1, did not select an Age Group in Q2.
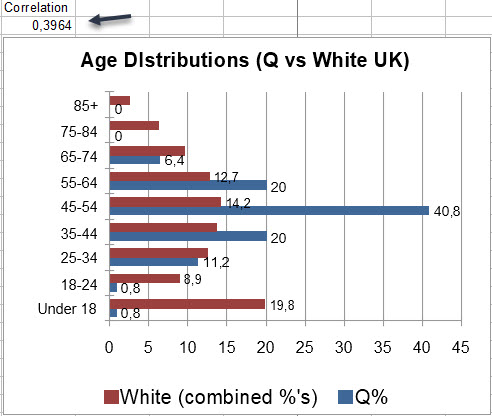
When compared with demographic data for respondents by race and country, those under age 25 and over age 74 years were under represented in the Questionnaire respondents.
This probably informs very little about actual age distribution of "long-term" COVID-19, and probably more about personal computer use habits, since the questionnaire depends on such access.
Q.3 - Date when illness began >>>>
Q.3 : Date illness began
LTCOVID.com
Thanks for visiting!
To translate this page, select your
language from the dropdown menu below:
The range of dates given for when this illness began extended from : November 14, 2019 to September 21, 2020. This later date seemed much more recent than most for being included in the "long-term" group, but was not excluded from the count.
The calculated mean of all values provided for when this illness began was 26 March, 2020, day 86 of the year, with a standard deviation of ± 45.02 days around that mean date.
The illness began before this date for 76 respondents, and for 59 after 26 March of this year.
A 20 day span (10 days before and 10 days after 26 March) included the Start of illness date for 55 respondents (41.67%). Extending this window to a 40 day span, from 6 March to 15 April, included 87 respondents (65.9% of the sample).
The duration of illness between start of illness date, and the date of the questionnaire response if still ill, was 6.56 ± 1.62 months, or 26.24±6.46 weeks.
Q.4 - Primary Language Spoken >>>>
Q.4 - Primary Language Spoken
LTCOVID.com
Thanks for visiting!
To translate this page, select your
language from the dropdown menu below:
129 respondents entered English as their primary language spoken.
2 entered Spanish.
2 skipped the question
Q.5 - Gender >>>>
Q.5 : Gender
LTCOVID.com
Thanks for visiting!
To translate this page, select your
language from the dropdown menu below:
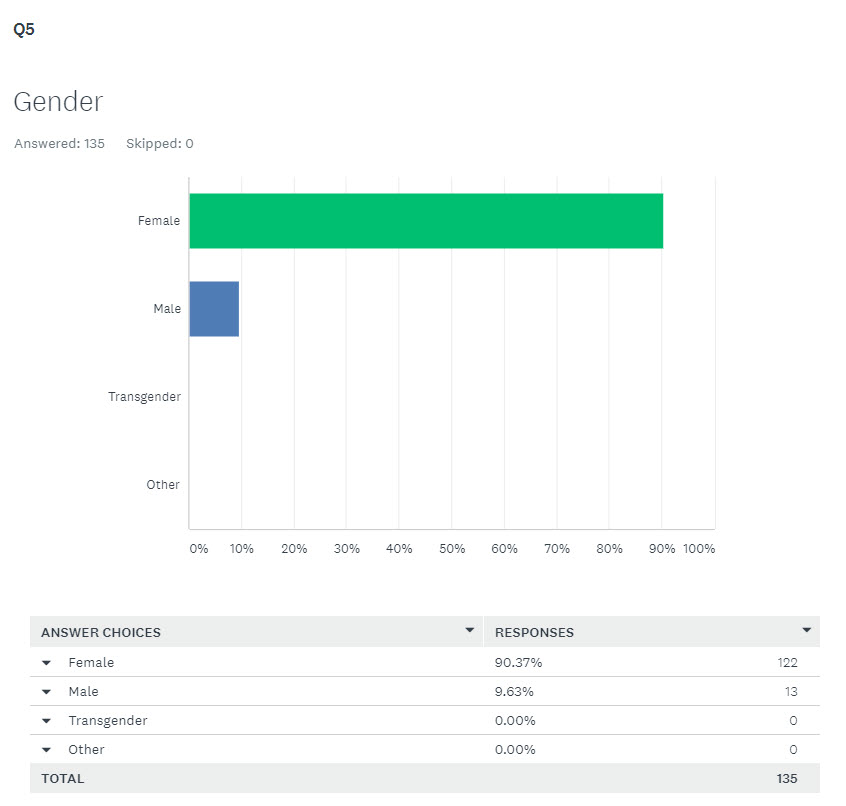
As shown below, 122 or 90.37% of respondents presenting with "long-term" COVID-19 were female and 13, or 9.63% were male.
Q.6 - Race >>>>


